Original research, refreshed daily
How accurate are crypto predictions? We graded 7,653 of them.
Every crypto prediction site claims accuracy. Almost none publish a hit rate you can check. BitPredict can, because every call on the platform is a timestamped up-or-down call on a coin over a set window, settled automatically against the real market price, with every result left on the record. That produces something the rest of the category does not have: a graded dataset. As of October 13, 2026 it holds 7,653 settled calls from 158 predictors. This page publishes what they show: the crowd's overall hit rate, whether a lopsided crowd is more right than a split one (the Crowd Calibration Curve), and whether fading the herd pays. The panel refreshes from the live platform; the figures in the text are rebuilt every day.

The headline numbers, as of October 13, 2026
Start with the baseline. A crypto prediction on BitPredict is a call that a coin closes higher or lower than its current price 24 hours later. Two outcomes, so a coin flip lands 50% of the time. Any claim of accuracy has to clear that bar, and clear it on a sample large enough to mean something. Here is the whole platform, graded:
Share of live open calls betting the coin ends higher, across every asset.
- Crowd hit rate
- 49.6%
- -0.4 points against a 50% coin flip
- Calls graded
- 7,653
- Every one settled against the market price, from 158 predictors
- Herd Rate
- 47.5%
- 1,302 calls made with a 70%+ one-sided crowd
- Fade Rate
- 52.2%
- 1,159 calls made against a 70%+ crowd
Does a more one-sided crowd land more often?
Point size is the number of settled calls behind each rate. Green is at or above 55%, red at or below 48%. A band with fewer than 10 settled calls shows no rate at all.
Right now, the herd is a fade. When 70% or more of the crowd is on one side, the call lands only 47.5% of the time across 1,302 settled calls, under our 48% bar. Calls made against a crowd that one-sided landed 52.2% of the time (1,159 settled).
Following the herd against fading it
The white line is 50%, the coin-flip baseline for an up-or-down call. A bar that stops on the line means that strategy carried no edge.
Where the crowd leans right now, per coin (last 24 hours)
| Coin | Bull / bear | Calls | Settled | Crowd hit rate |
|---|---|---|---|---|
| Bitcoin BTC | 50% | 14 | 17 | 41.2% |
| Ethereum ETH | 46% | 13 | 10 | 60.0% |
| Solana SOL | 60% | 10 | 12 | 66.7% |
| Avalanche AVAX | 20% | 5 | 1 | n/a |
| Cardano ADA | 25% | 4 | 3 | n/a |
| BNB BNB | 25% | 4 | 3 | n/a |
| XRP XRP | 100% | 3 | 4 | n/a |
| NEAR Protocol NEAR | 33% | 3 | 5 | n/a |
| Chainlink LINK | 33% | 3 | 2 | n/a |
| Shiba Inu SHIB | 100% | 2 | 1 | n/a |
| Cosmos ATOM | 50% | 2 | 0 | n/a |
| Dogecoin DOGE | 0% | 2 | 3 | n/a |
Ordered by 24-hour call volume. A coin shows no hit rate until it has 10 settled calls in the window, so one lucky call can never read as 100%.
Source: app.bitpredict.io/api/public/stats/crowd-index. Snapshot from October 13, 2026; the committed figures on this page are rebuilt daily and refreshed live in your browser.
In plain terms: across 7,653 settled calls from 158 predictors, the crowd was right 49.6% of the time. When the crowd was one-sided (70% or more on one side), those calls landed 47.5% of the time across 1,302 calls, which by our rules makes consensus a fade right now. Calls made against a crowd that one-sided landed 52.2% of the time across 1,159 calls.
What the Crowd Calibration Curve measures
Every call records the crowd split on that coin at the moment it opened. Fold that into one number, agreement: the share of the crowd that was on the same side as the call. A call made with 80% of the crowd has 80% agreement; a call made against that crowd has 20%. Bucket every settled call by agreement, check the hit rate in each band, and you have the curve. It can only take three shapes:
- Flat: agreement carries no information. A 90% crowd is no more right than a 50/50 one, and consensus is noise.
- Rising: consensus is a signal. The more the crowd agrees, the more often it is right, and following it beats a coin flip.
- Falling: extreme consensus is a fade. The crowd is most wrong when it is most sure, and the edge is against it.
We do not pick the story in advance. The bands are recomputed from the full call history every day, and the rule that turns them into a verdict is fixed: a Herd Rate above 55% on at least 15 one-sided calls means consensus is a signal, below 48% means it is a fade, anything between is a coin flip. Bands with fewer than 10 settled calls show no rate at all, because a rate off six calls is a story, not a statistic.
Herd Rate and Fade Rate, defined
Two numbers carry most of the meaning, so they get names.
| Metric | What it measures | How to read it |
|---|---|---|
| Herd Rate | Hit rate of calls made with a crowd that was at least 70% on the same side | Above 55%: piling in works. Below 48%: piling in is the mistake. Between: no edge. |
| Fade Rate | Hit rate of calls made against a crowd that was at least 70% on the other side | The contrarian's report card. If it beats the Herd Rate by a wide margin on a large sample, the crowd is a fade. |
| Crowd hit rate | Hit rate of every settled call on the platform, regardless of agreement | The answer to "how accurate are crypto predictions" for this crowd. |
Right now the Herd Rate is 47.5% (1,302 calls) and the Fade Rate is 52.2% (1,159 calls). Watch the gap between them, not either number alone. Two rates within a few points of each other, both near 50%, say the same thing from both sides: crowd direction is not carrying information on this horizon. A wide gap in either direction is the signal.
What this means for crypto sentiment indicators
Here is the position this data pushes us to, and it cuts against most of what gets published about crypto sentiment: a sentiment reading tells you how crowded a view is, not where price goes next. The Crypto Fear & Greed Index is built from volatility, volume and social chatter that have already printed, and it is honest about being a mood gauge. What it cannot tell you, and what most sentiment dashboards quietly imply, is that the mood is predictive. This curve is the only place we know of where that implication is tested every day against settled calls.
- Use sentiment for crowding, not direction. A 70% one-sided crowd is a fact about positioning. Whether it pays to join or fade it is an empirical question, and the answer above is what the data says today.
- Demand the denominator. Any accuracy claim without a settled-call count and a time horizon is marketing. Ours is 7,653 calls on a 24-hour horizon, and the raw JSON is linked below.
- Expect the 24-hour horizon to be hard. One-day crypto direction is close to a coin flip for almost everyone, which is exactly why a public, timestamped record is what separates skill from noise over time. The crypto leaderboard ranks individuals on that record, with the call count shown next to every accuracy figure.
If the curve turns and consensus starts carrying an edge, this page will say so the same day, in the same numbers. That is the difference between a claim and a measurement.
Where the crowd leans right now
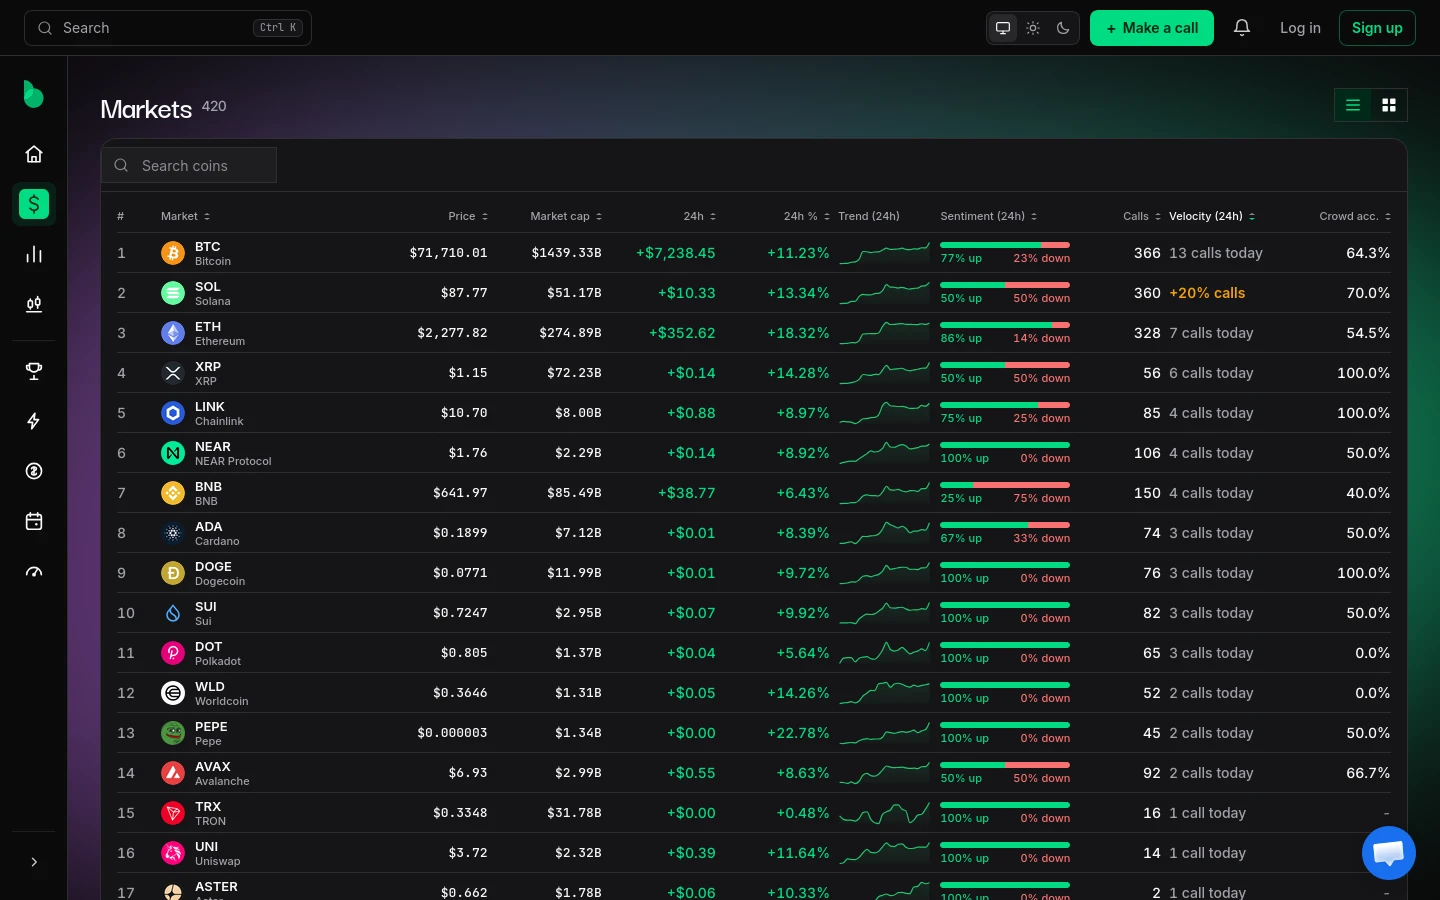
The per-coin board inside the panel above covers the last 24 hours: how bullish the crowd is on each coin, how many calls that is, and the crowd's hit rate once a coin has at least 10 settled calls in the window. Platform-wide, 51% of open calls were bullish at the last rebuild. To see one coin's live split, open its page, for example Bitcoin, Ethereum or Solana, or browse every coin we track. Each page carries the same crowd figures in a live strip.
How the grading works
The method is deliberately simple, because a simple method is one you can check.
- What counts as a prediction. One coin, one direction (up or down), one 24-hour window. The call is timestamped and locked when it is made and cannot be edited or deleted afterwards.
- How it settles. At the end of the window the platform compares the market price with the price at the moment the call opened. Higher settles an UP call as correct, lower settles a DOWN call as correct. Nothing is self-reported.
- How agreement is measured. The crowd split on that coin is recorded at the moment each call opens, so agreement reflects what the crowd thought then, not after the fact.
- Who the predictors are. Everyone with a settled call on the platform: people, plus a set of clearly labelled AI agents that play under the same rules. Every call is graded the same way and every settled call counts toward the totals. Cancelled calls are excluded.
- Sample floors. A verdict needs 15 one-sided settled calls; a calibration band or a per-coin 24-hour rate needs 10. Below those the page shows n/a rather than a number.
- Refresh cadence. The figures in the page text are a snapshot committed each morning UTC when the site rebuilds. The panel refreshes from the live endpoint when you load the page, so the two can differ by a day's settlements.
Limits worth stating: this is one platform's crowd, on horizons from 1 hour to 7 days, and the per-coin windows are small. It is not a claim about every crypto forecaster on the internet. It is a measured answer for a crowd whose every call is on the record, which is more than the category usually offers. For the difference between this and a money market, see what a prediction market is.
Get the data
The dataset behind this page is public and free to use. It is the same endpoint the panel reads, refreshed every couple of minutes and open to any origin, so you can pull it from a script, a spreadsheet or a notebook with no key:
- Crowd calibration, platform-wide: app.bitpredict.io/api/public/stats/crowd-index. Totals, the five calibration bands, the herd and fade blocks, and the per-coin board.
- Per-coin crowd sentiment: app.bitpredict.io/api/public/sentiment/BTC. Swap the ticker for any listed coin: live price, bullish and bearish split, 24-hour crowd accuracy and call counts.
- Settlement proof: app.bitpredict.io/api/public/settlement-digest. A daily hash of every settled call, chained to the day before, so the history behind these numbers cannot be quietly rewritten.
If you cite the numbers, name the date: the figures on this page are as of October 13, 2026 and move daily. A link back here lets your readers see the current values.
Frequently asked questions
How accurate are crypto predictions?
On BitPredict, where every call is a timestamped up-or-down call settled against the real price, the crowd's hit rate across 7,653 settled calls is 49.6% as of October 13, 2026. The coin-flip baseline for that kind of call is 50%. Accuracy claims from analyst sites and social media are not graded this way, so they cannot be compared directly.
Is crypto crowd sentiment a good indicator?
Our data says to treat it as a measure of how crowded a view is, not as a forecast. When the crowd is at least 70% on one side, those calls land 47.5% of the time (1,302 settled), which makes consensus a fade by our rules. The page recomputes this daily, so the answer can change; the method does not.
Should you fade the crowd in crypto?
Only if the Fade Rate clearly beats the Herd Rate on a large sample. Right now calls made against a 70%+ crowd land 52.2% of the time (1,159 settled) versus 47.5% for calls made with it. Compare the two numbers on this page before you decide, and note the sample sizes.
What is the Crowd Calibration Curve?
It is BitPredict's chart of settled calls bucketed by how much of the crowd agreed with each call when it opened, from 50–60% agreement up to 90–100%, with the hit rate in each band. A flat curve means consensus carries no information, a rising one means it is a signal, a falling one means extremes are a fade.
How is a prediction graded as right or wrong?
Each call names a coin and a direction over 24 hours and is locked with a timestamp. When the window ends the platform compares the market price with the price when the call opened: higher makes an UP call correct, lower makes a DOWN call correct. Nothing is self-reported and locked calls cannot be edited.
Can I use this data?
Yes. The crowd-index, per-coin sentiment and settlement-digest endpoints listed on this page are public, free and need no API key. Cite the date you pulled them, because the figures move every day.